RIS Feed
Indicator
Wildlife economy potential
21088
Indicator
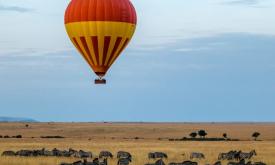
Wildlife-watching species richness
This indicator represents wildlife-watching species richness at country level. Wildlife watching species/groups include Rhinos, Elephant, Lion, Leopard, Buffalo, Giraffe, Lowland and Mountain Gorilla, Chimpanzees, Bonobo, Sifaka, Ringtails, Aye-Aye, Mouse lemurs and Colobus. Number of occurring species/groups is weighted by specific scores of attractiveness and encounter easiness based on experts opinion.
21087
Indicator
Human pressure potential index in PAs
Indicator of potential human pressure in and around protected areas derived from indices of forest loss, population and agriculture pressures (DOPA 4.0).
21027
Indicator
Above-ground biomass stock in forest (tonnes per hectare)

Changes in the above-ground biomass stock in forest indicate the balance between gains in biomass stock due to forest growth and losses due to wood removals, natural losses, fire, wind, pests and diseases. At country level and over a longer period, sustainable forest management would imply a stable or increasing biomass stock per hectare, while a long-term reduction of biomass stock per hectare would imply either unsustainable management of the forests and degradation or unexpected major losses due to fire, wind, pests or diseases.
20988
Indicator
Oil Palm Extent

Industrial and smallholder oil palm plantation data.
20971
Indicator
Mangrove Forests Extent in Protected Areas
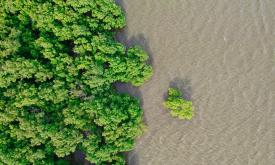
This dataset shows the Mangrove Forests Protection for the year 2016 and the country mangrove extent for years 1996 and 2016. The dataset is a subset of the global mangrove extent dataset generated by the Global Mangrove Watch (GMW) – a collaboration between Aberystwyth University (U.K.), solo Earth Observation (soloEO), Wetlands International, the World Conservation Monitoring Centre (UNEP-WCMC) and the Japan Aerospace Exploration Agency (JAXA).
20919
Indicator
Vulnerability to global tourism and travel crisis
20775
Indicator
Visitors to protected areas index
Which protected areas are visited most frequently?
Average annual number of visitors to a protected area. Data are currently available for a limited set of sitesand from different sources, published in the study: Balmford A, Green JMH, Anderson M, Beresford J, Huang C, Naidoo R, et al. (2015) Walk on the Wild Side: Estimating the Global Magnitude of Visits to Protected Areas. PLoS Biol 13(2): e1002074. https://doi.org/10.1371/journal.pbio.1002074.
20774
Indicator
Adaptation capacity index (lack of)
Adaptation capacity
This is a composite indicators of the capacity of responding and adapting to the crisis derived from indicators of poverty, food security, governance, communication and physical connectivity. It is obtained from a linear combination of single standardised dimensions, then standardised in a 0-1 range where 1 means lack of adaptation capacity.
It can be used for vulnerabliity and risk analysis. It is one of the dimension of the vulnerability to global tourism and travel crisis.
20770
Indicator
Biodiversity important areas index
Index of biodiversity importance based on Key Biodiversity Areas coverage and species richness from IUCN Red List. It can be used as proxy of biodiversity exposure in risk and vulnerability analysis.
It is a dimension of the composite indicator on vulnerability to global travel and tourism crises.
References
20767