Near Real Time Datasets
Explore global near real-time datasets
Coronavirus World Airport Impacts
-
Last 1 Day
Coronavirus World Airport Impacts
Screening - Some sort of screening is taking place for arriving and/or departing passengers.
Restrictions - Some level of international travel restrictions are in place (denying entry, quarantining passengers arriving from certain locations or cancelling all flights to and from a certain location).

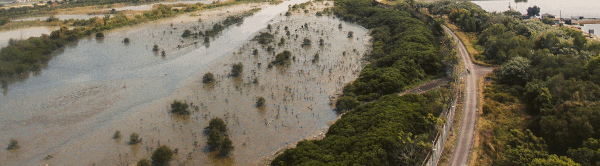
Flood hazard 100 year return period
-
Shallow
-
Moderate
-
Deep
-
Very deep
Inundated areas for flood events with a return period of 100 years, based on GloFAS climatology. Permanent water bodies derived from the Global Lakes and Wetlands Database and from the Natural Earth lakes map (naturalearthdata.com).
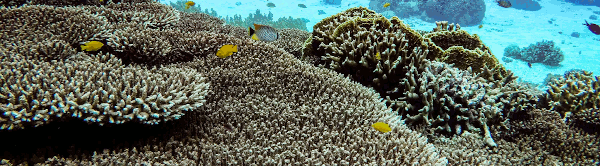
Coral Bleaching HotSpot
-
1°C
-
2°C
-
3°C
-
4°C
-
5°C
The twice-weekly global 50km Coral Bleaching HotSpot product presented here was used to measure the occurrence and magnitude of instantaneous coral bleaching-inducive heat stress. See the 'Coral Reef Watch Operational 50km Satellite Nighttime SST Climatologies' table above to access the Maximum Monthly Mean (MMM) SST climatology, used before February 1, 2016 for this product.